Materialization status
The Materializations tab shows all your pre-aggregates and their current state.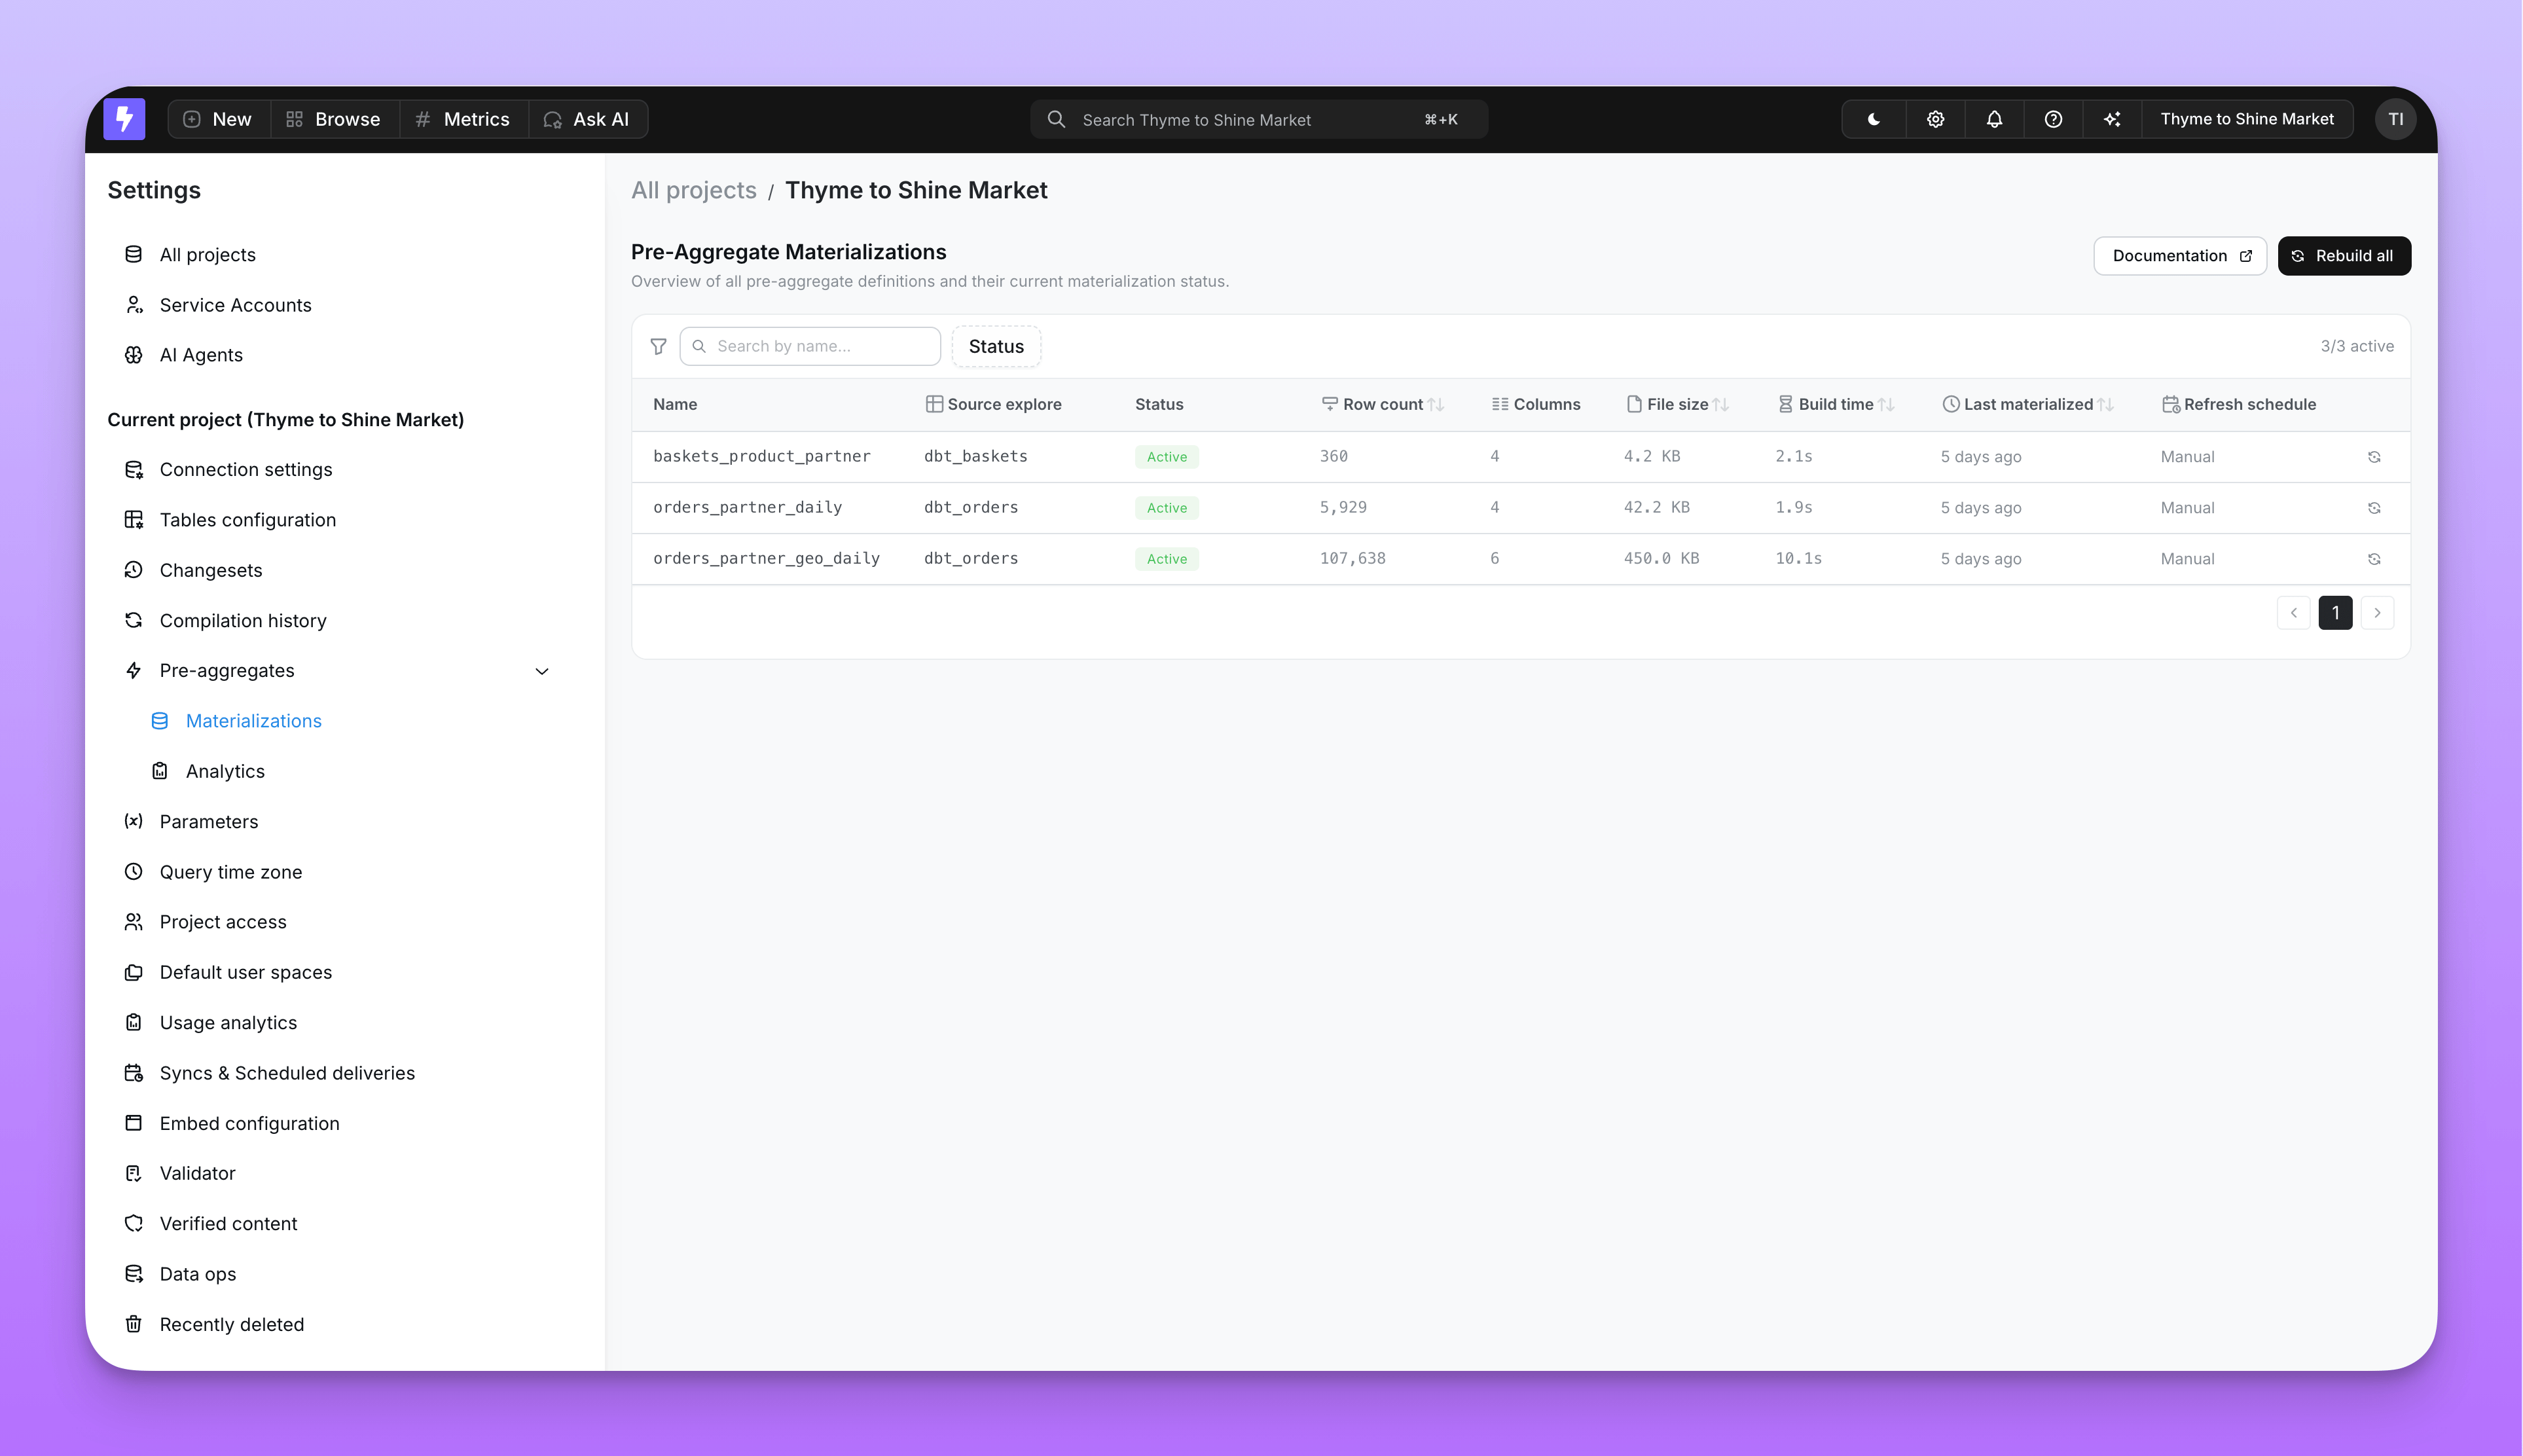
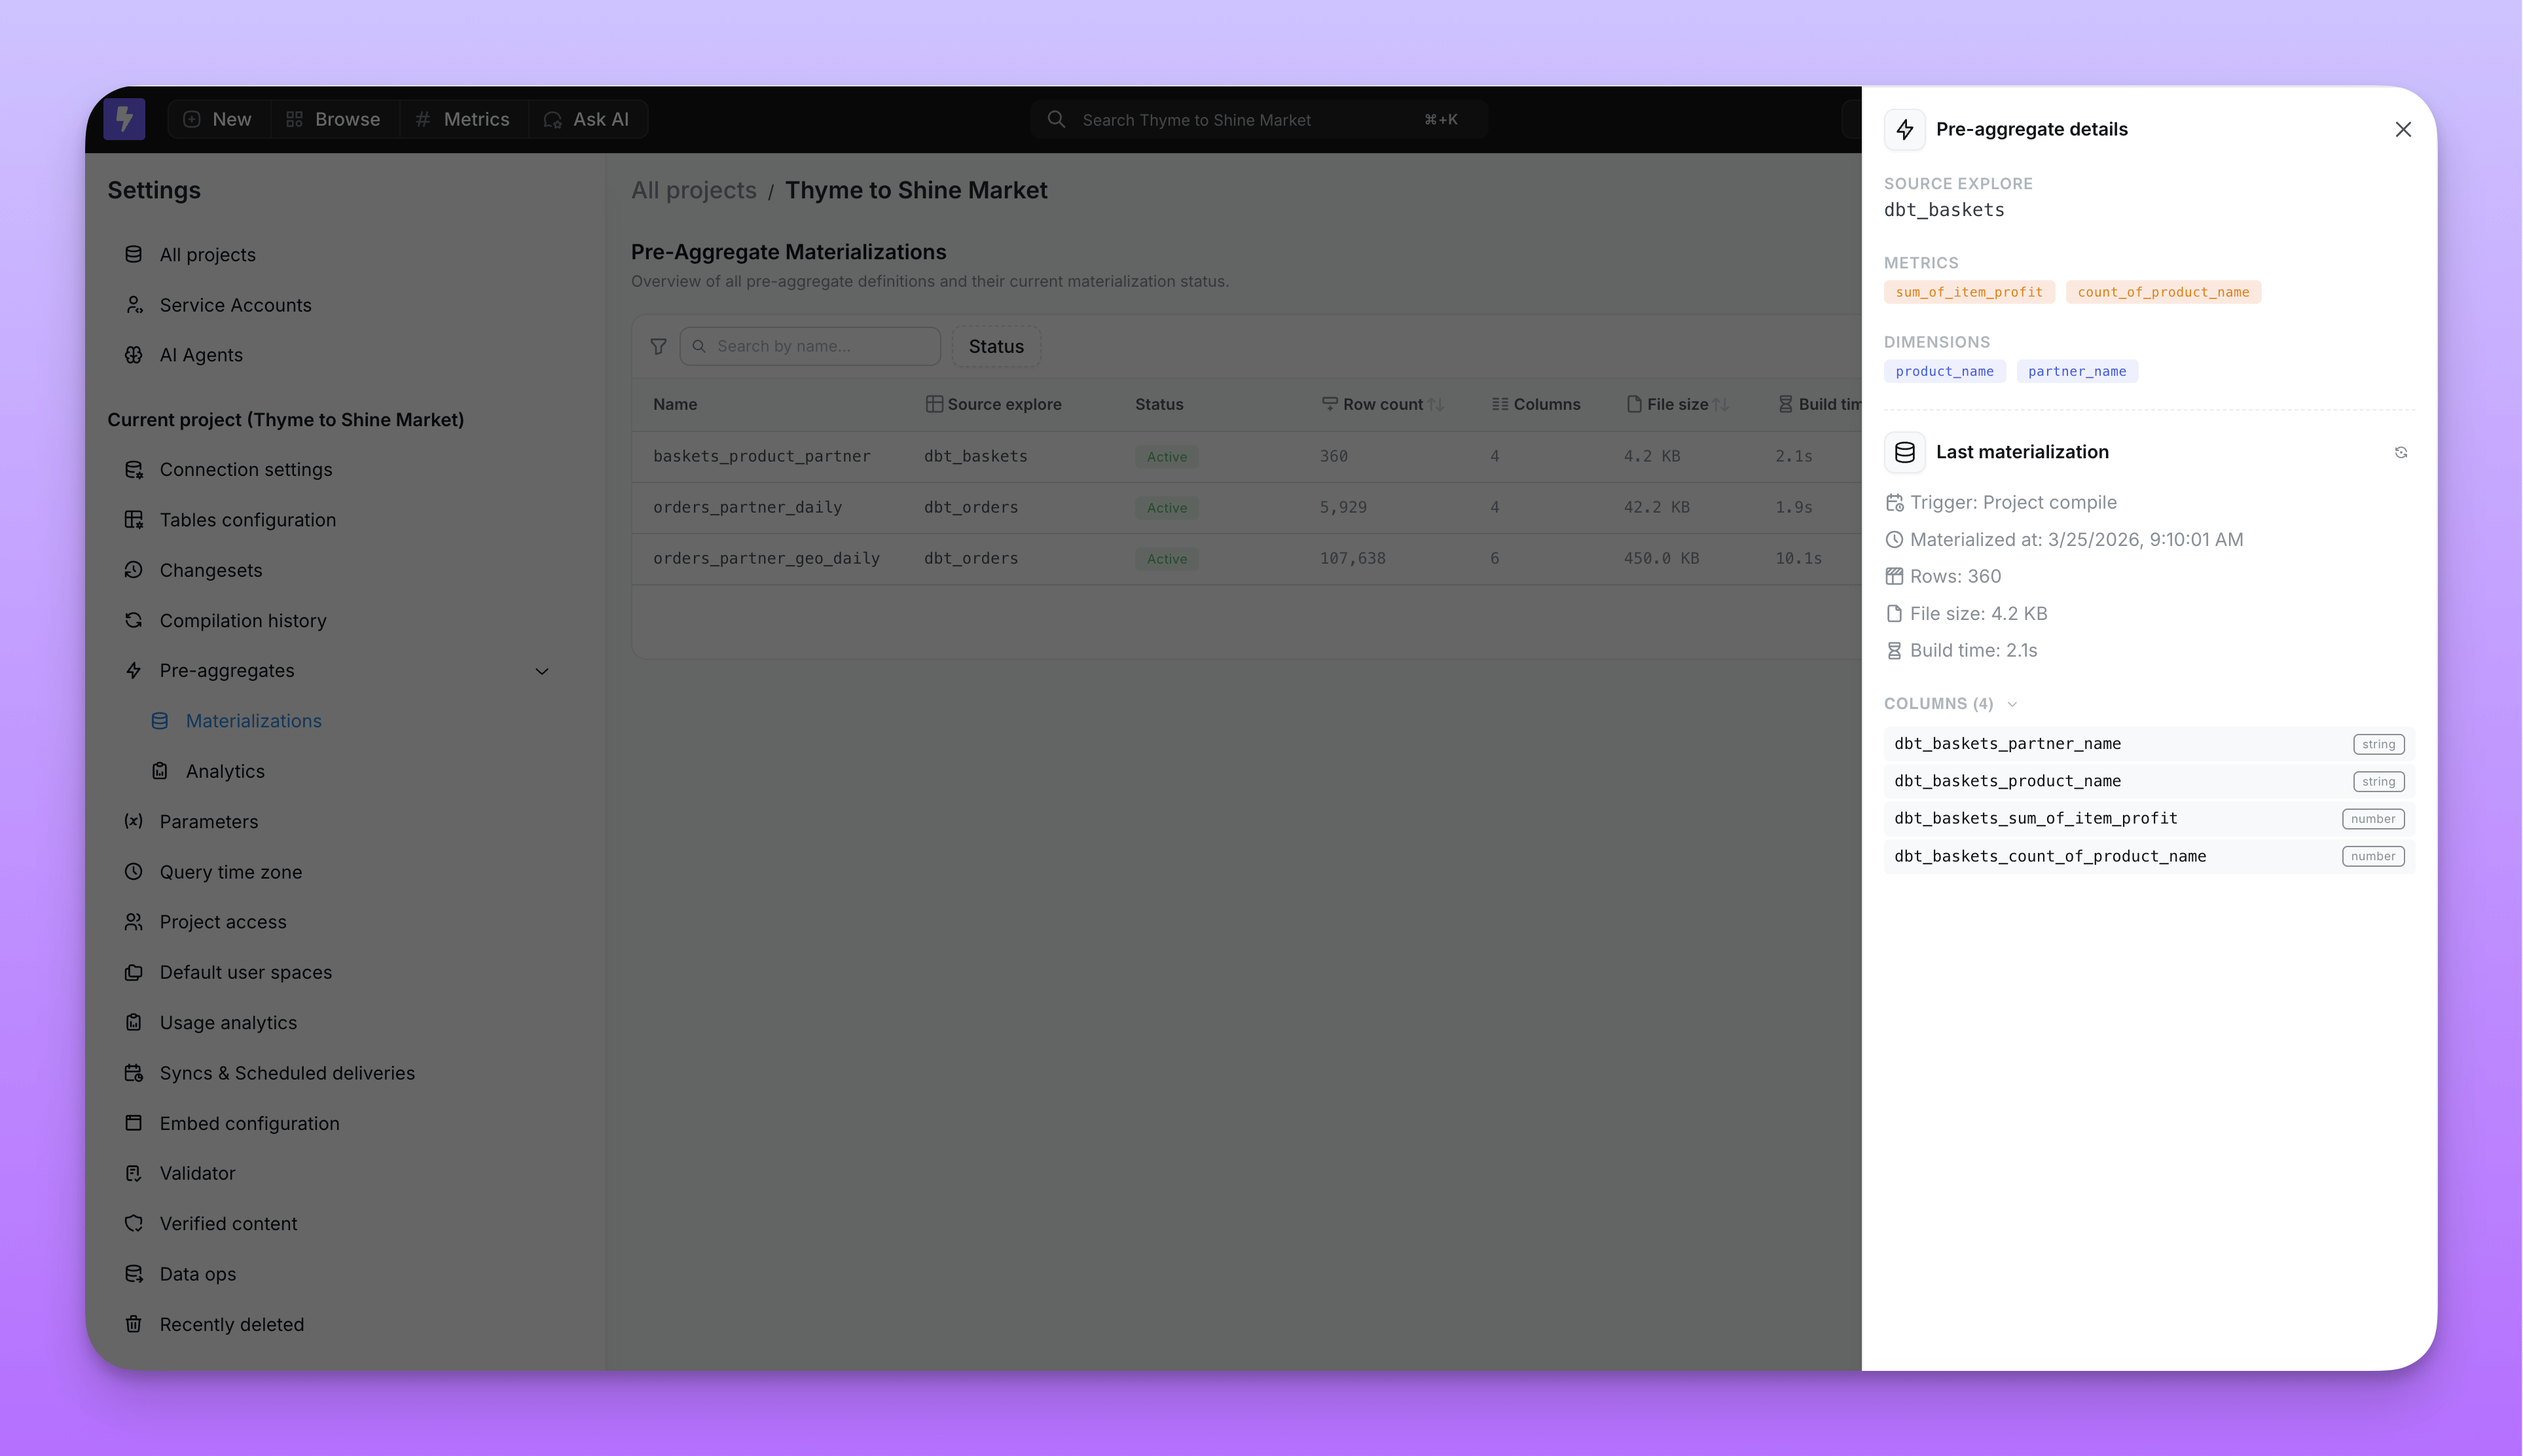
You can click on any pre-aggregate to see its full details, including row count, file size, and duration.
Hit and miss statistics
The Analytics tab tracks how often queries hit or miss pre-aggregates on a daily basis.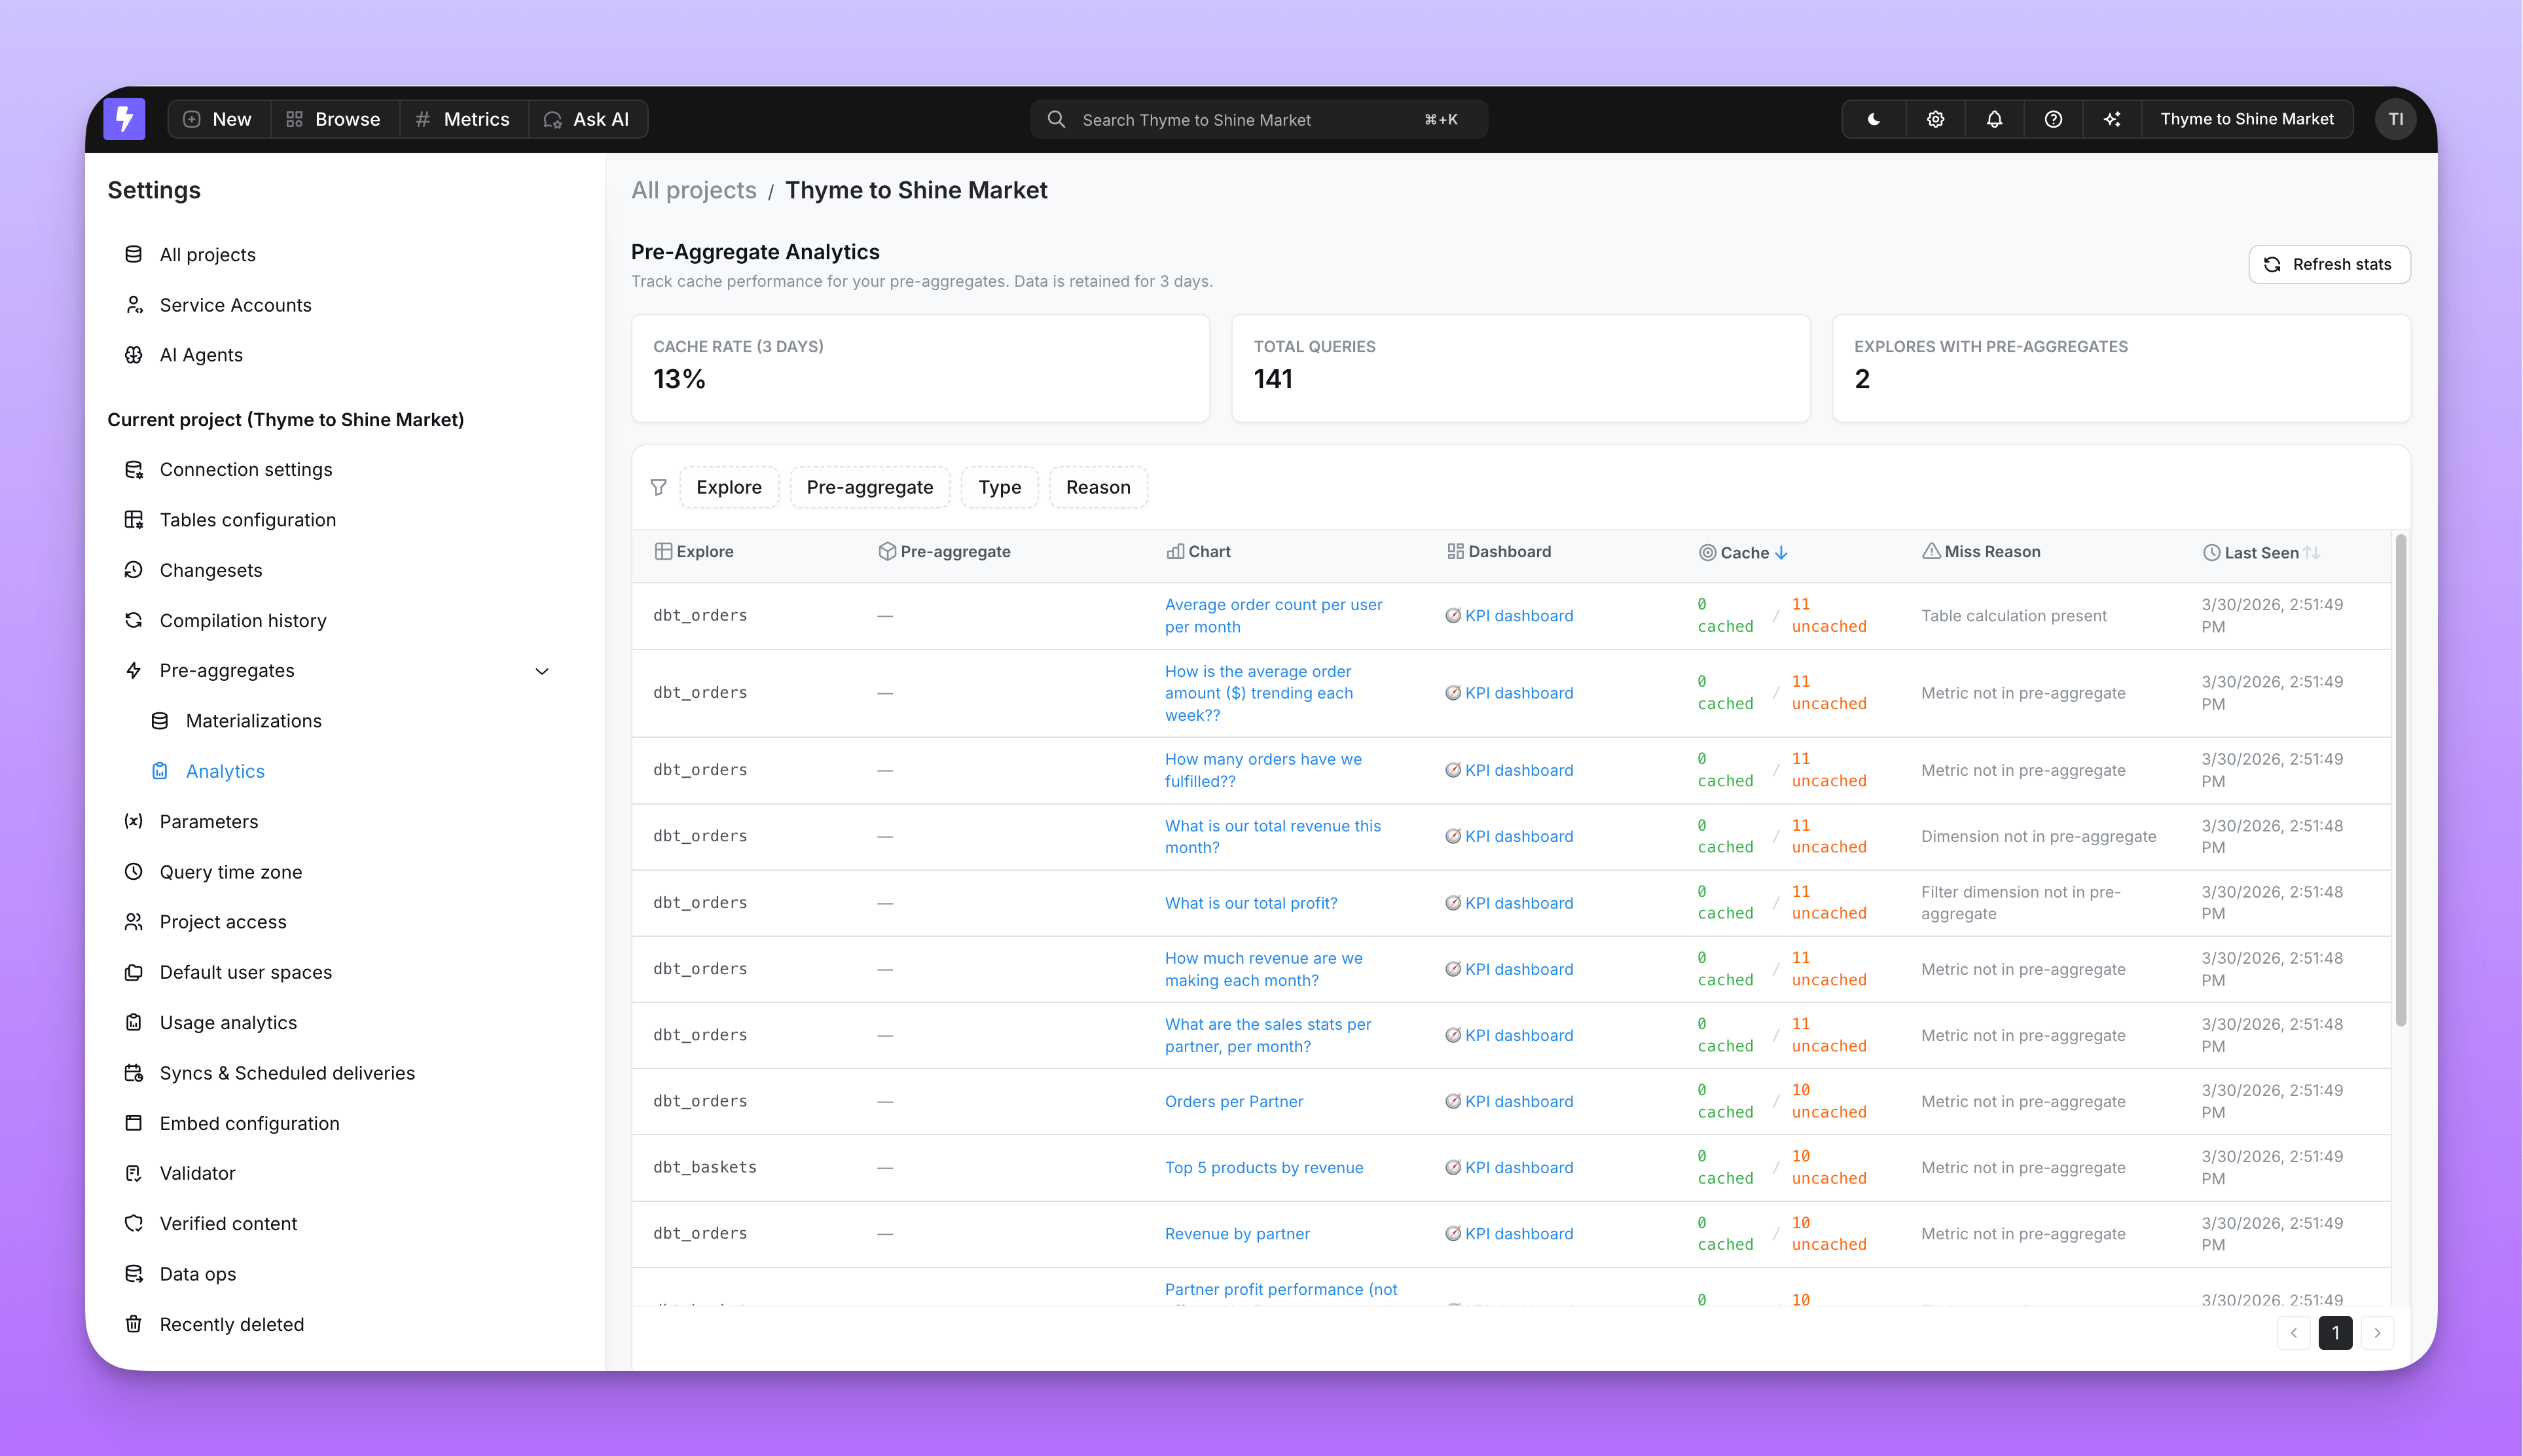
- Explore name — which explores are benefiting from pre-aggregates
- Query context — whether the query came from a chart, dashboard, or the explorer
- Chart or dashboard — which specific saved content is hitting or missing
Why a query misses a pre-aggregate
When a query doesn’t match any pre-aggregate, Lightdash records the specific reason. Understanding these reasons helps you decide whether to adjust your pre-aggregate definition or accept the warehouse query.Dashboard pre-aggregate view
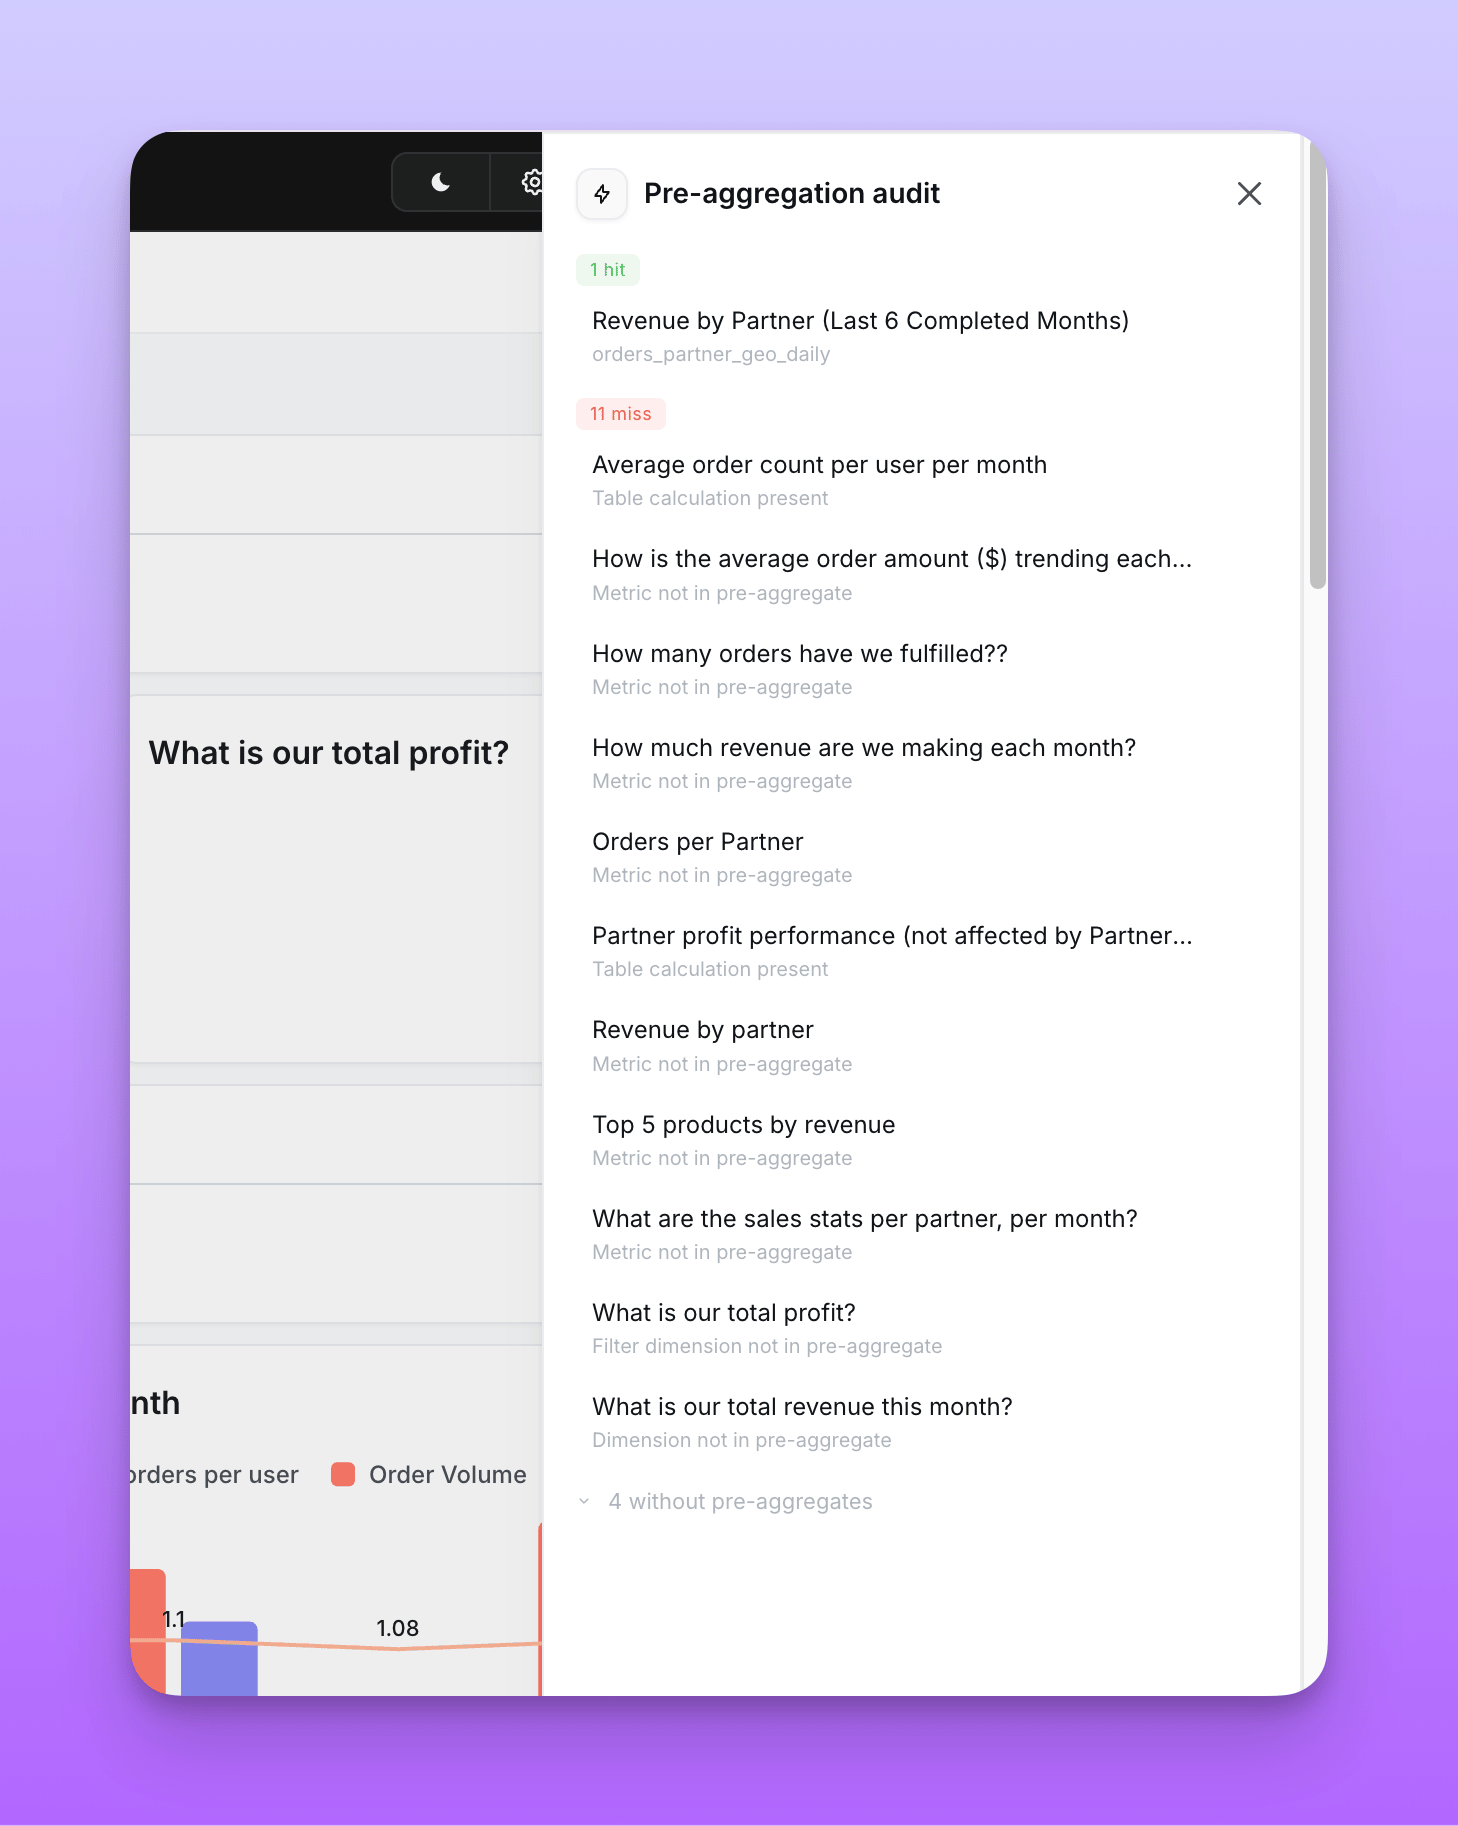
You can also monitor and manage pre-aggregates directly from any dashboard. Open the dashboard menu to access pre-aggregate options.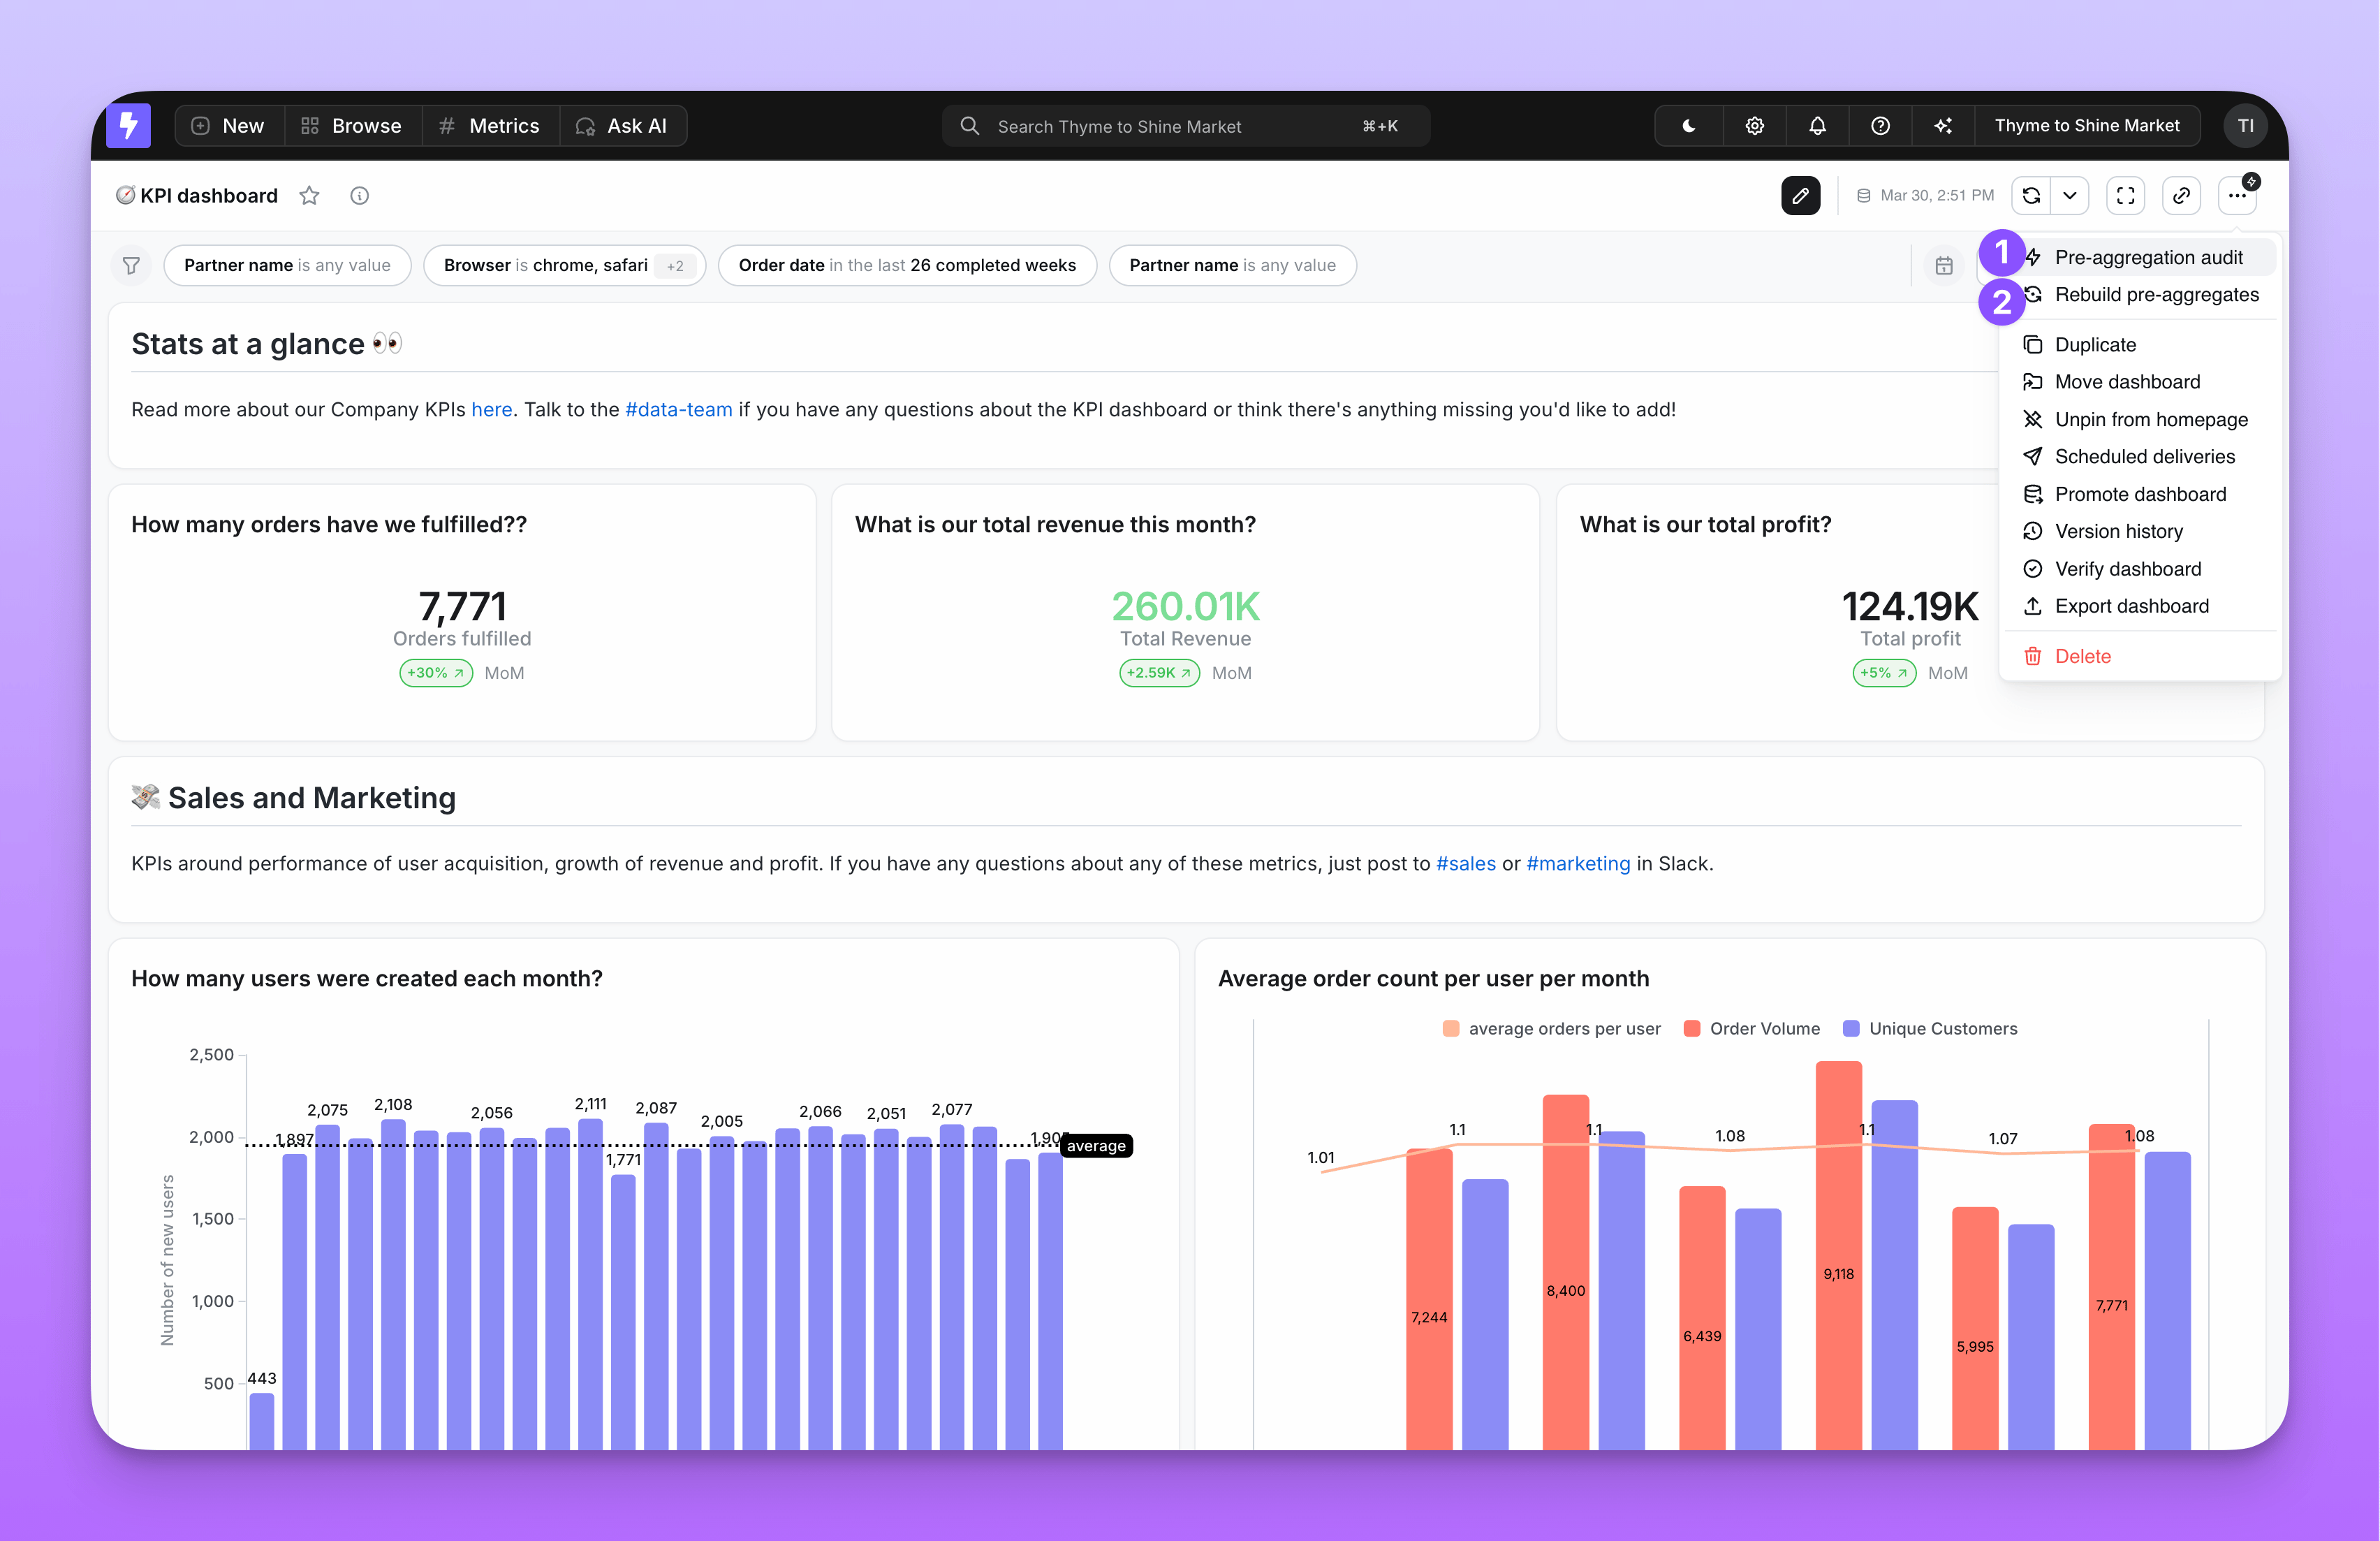
- Pre-aggregation audit — Shows which tiles in the dashboard are hitting or missing pre-aggregates, and why. Available to editors, developers, and admins.
- Rebuild pre-aggregates — Triggers a manual re-materialization for the pre-aggregates used by this dashboard. Available to developers and admins only.